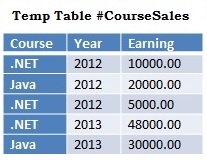
Brief Overview
SQL Server 2008 product included one of the services called as “SQL Server Reporting Services 2008 (SSRS)”. SSRS is a full-featured application that provides report design, development, testing, and deployment of reports by the use of Business Intelligence Development Studio (BIDS) developer tool for all its operations.
In this tutorial, we will go through a number of stages so as to understand successful creation and deployment of reports.
Below are the stages of SQL Server Reporting Services we are going to cover in this article.
- Architecture
- Installation
- Role of Business Intelligence Development Studio (BIDS)
- Report Creation with the Wizard
- Report Creation with the Report Designer
- Reports Deployment
- Security Configuration
Architecture
SSRS block diagram as shown below has been taken from an online book for reference purposes:
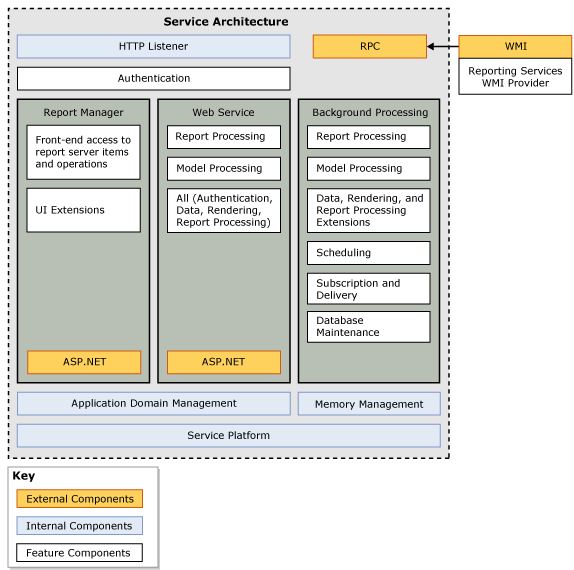
- Reporting Services include an HTTP listener that monitors incoming requests directed to HTTP.SYS on a specific port on the local computer. The host name and port are specified on a URL reservation when you configure the server.
- Report Manager is an ASP.NET application that provides a browser-based interface for managing Reporting Services.
- Reporting Services include an Authentication Layer that verifies the identity of the user or application that makes the request. The following authentication types are supported: Windows integrated security, NTLM authentication, Basic authentication, Forms or custom authentication, and Anonymous access. Reporting Services uses Windows integrated security and NTLM authentication by default.
- The Web Service is also implemented as an ASP.NET application; it provides a programmatic interface to Reporting Services.
- By default, reporting services creates and uses two SQL Server 2008 databases instances named
ReportServer and ReportServerTempDB. The ReportServerTempDB database is used for temporary storage.
Installation
Run the SQL Server 2008 setup.exe program to install SSRS in your machine. Setup will guide you through the various installation and configuration options for the product. Let’s discuss the installation and configuration of SSRS.
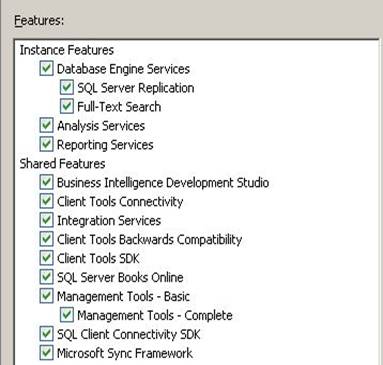
Once setup.exe file has been run, you will reach the Feature Selection dialog. Click the checkbox for Reporting Services to perform the installation of SSRS as shown below:
Later in the SQL Server 2008 installation process, you will reach the Reporting Services Configuration dialog as shown below:
Select the first option - Install the native mode default configuration. This will install SSRS and configure it for you automatically. SharePoint integrated mode disables the Report Manager and allows you to store reports in SharePoint document libraries; to run a report, you simply click on it.
The last option is useful where you want to configure the report server manually using the Reporting Services Configuration Manager.
Hurray!!…Half of your job is done. Let’s go in deep to understand more about Reporting services.
Role of Business Intelligence Development Studio
BIDS is included with SQL Server product. When you are running the SQL Server installer, you need to click the Business Intelligence Development Studio checkbox in order to install BIDS. After successfully completing the installation, you are ready to launch BIDS from the Microsoft SQL Server 2008.
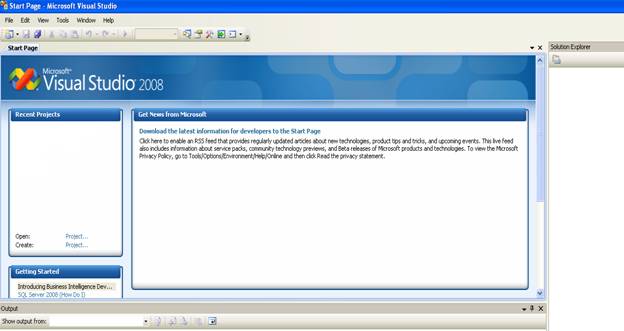
On click, BIDS window appears as shown below:
Now, Click File, Add, New Project (ctrl+shift+N) from the top-level menu to add a Report Server project to the solution. Fill in the Add New Project dialog as shown below:
At this point, we have created a Report Server project called “Report Project1” as shown above.
Report Creation with the Wizard
In this section, we will use the Report Wizard to build a report. Let’s go through the following steps:
- Launch the report wizard
- Create a shared data source
- Design a query
- Select a report type
- Design a table
- Choose the table layout
- Complete the wizard
Launch the Report Wizard
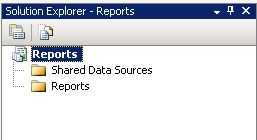
The BIDS Solution Explorer shows our Report Server project along with Shared Data Sources and Reports components as shown below:
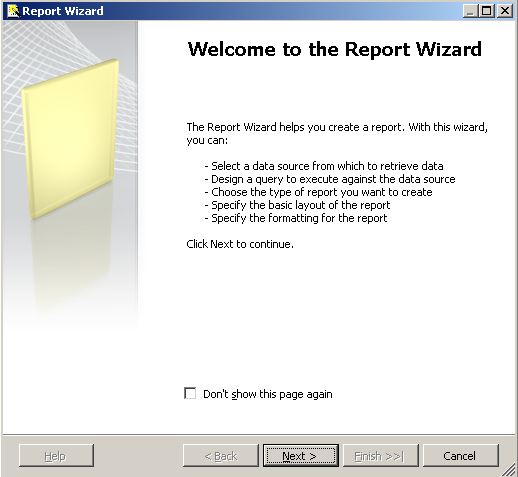
Right click on the Reports node and select Add New Report to launch the Report Wizard as shown below:
(Note: The checkbox "Don't show this page again" if you don’t want to see this dialog box every time you want to design a new report using the wizard.)
Click the Next button to create a data source for your report which we will explain in the next section.
Create a Shared data Source
The Data Source contains the information necessary to retrieve the data we pull in our report. Reporting Services can access data in relational databases, OLAP databases, and any other data source for which like an ODBC or OLE DB driver, etc.
When we create a Data Source, we can specify it as shared which means it can be used by any report in the same project. If a Data Source isn't shared, it means that its definition is stored inside the report and it cannot be shared with another report.
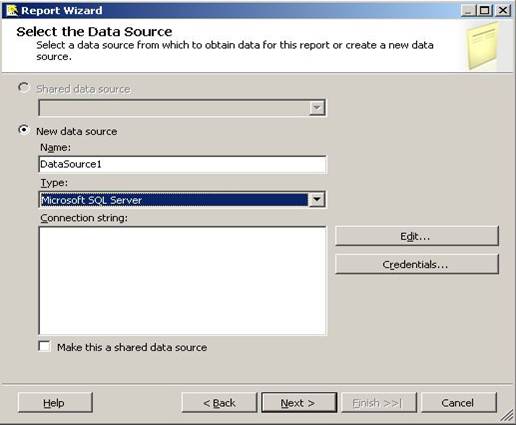
After launching the Report Wizard, you will be presented with the Select the Data Source dialog as shown below:
Our project does not have any Shared Data Sources yet, so we do not have the option of selecting an existing Shared Data Source for our new report. Instead, we will have to define a Data Source by supplying the below parameters:
- Name - Name for the Data Source. Do not put any spaces in the name; if you do, you will get an error message when you complete the wizard and your Data Source will not be created.
- Type - Select from the available options in the dropdown list; for demonstration purposes,
ReportServerdatabase that we are using.
- Connection String - Enter the connection string for your Data Source; usually you will want to click the Edit button to enter the details and have the connection string created for you.
- Edit button - Rather than entering the connection string, click this button to display the Connection Properties dialog where you can enter some information and have the connection string created for you.
- Credentials button - Click this button to display the specify Data Source Credentials dialog where you can specify the credentials to use when connecting to your Data Source.
- Make this a shared data source checkbox - click this checkbox to create a Shared Data Source; any report in the same project can the use this Data Source.
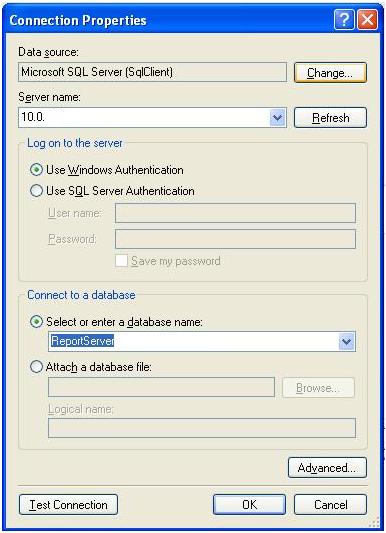
Click the Edit button to display the Connection Properties dialog; fill in your Server name and select theReportServer database as shown below:
The Server name is the one where your SQL Server database is deployed. If you are running a named instance of SQL Server, you will need to specify the Server name as SERVERNAME\INSTANCENAME. If you are running SQL Server locally, you can specify localhost in place of SERVERNAME. You should click the Test Connection button to verify that you are able to connect to the database, then click OK to close the dialog.
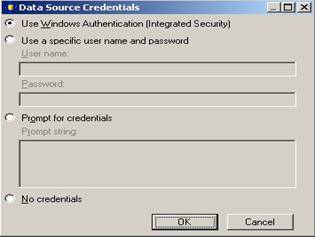
Click the Credentials button to display the Data Source Credentials dialog as shown below:
The default selection is Use Windows Authentication (Integrated Security). This means that Reporting Services will connect to the Data Source using the Windows credentials of the person running the report. After completing the above steps, the Select the Data Source dialog will look as shown below:
Click Next to move on to the Design the Query dialog which we will discuss in the next section.
Design the Query
The Design Query step of the Report Wizard allows us to specify what data we want to retrieve from our Data. In this section, we will walk through the details of defining a query to retrieve the data to get on our report.
The Design the Query step in the Report Wizard will display the dialog as shown below:
You can click the Query Builder button to graphically build your query or you can type your query directly into the Query window. The following is an example of a query that you could type in:
 Collapse | Copy Code
SELECT  E.EMP_NAME,
   E.DESIGANTION,
   E.HIRE_DATE,
   E.SALARY,
   D.DEPT_NAME,
   D.LOCATION
FROM
   EMPLOYEE E
INNER JOIN
   DEPARTMENT D
   ON
   E.DEPT_NO = D.DEPT_NO
ORDER BY
     E.EMP_NAME ASC
Click Next to move on to the Select the Report Type dialog which we will discuss in the next section.
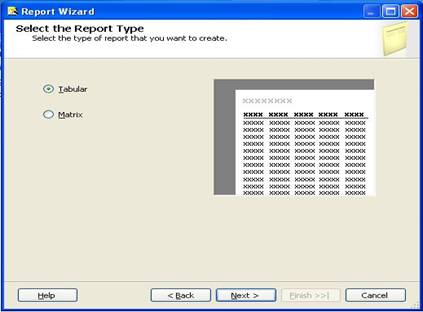
Select the Report Type
The Select Report Type step of the Report Wizard allows us to choose from a Tabular or Matrix type of report.
The Select Report Type step in the Report Wizard will display the dialog as shown below:
The tabular report type is the traditional report with page headings, column headings, subtotals and totals running down the page.
The matrix report type is one where we define the fields that go on the columns and rows. We'll create a tabular report as this will provide a simple and familiar picture.
Click Next to move on to the Design the Table dialog which we will discuss in the next section.
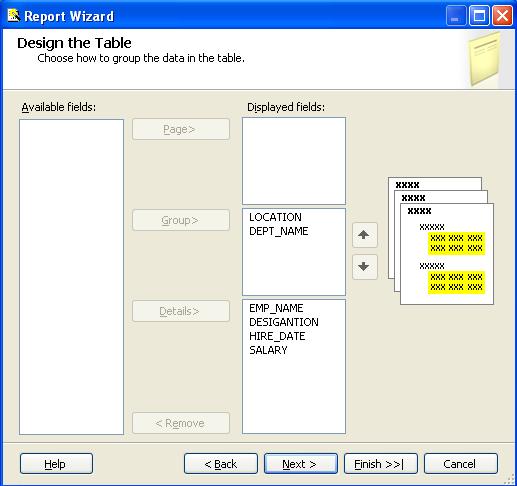
Design the Table
The Design Table step of the Report Wizard allows us to layout the available fields on our report choosing between Page, Group, and Details.
The Design Table step in the Report Wizard will display the dialog as shown below:
The Available fields list is populated based on the query that you used in the previous step in the Report Wizard. Click on a field, then click on the appropriate button where you want to put that field. Fill in the dialog as shown below:
The following is a description of the buttons in the above dialog:
- Page - Put a field in this list when you want to begin a new page when the value of the field changes
- Group - Group by the fields in this list
- Details - The fields in this list appear in each row of the report
Click the Next button to move on to the Choose the Table Layout dialog which we will discuss in the next section.
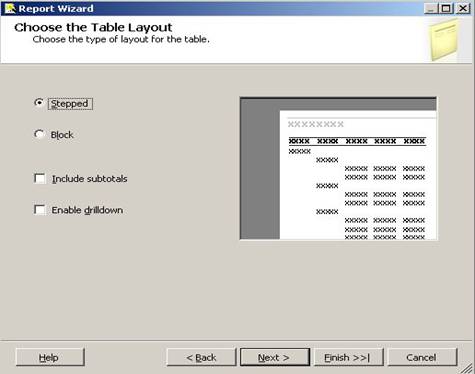
Choose the Table Layout
The Choose Table Layout step of the Report Wizard allows us to choose a stepped or blocked layout and whether to include subtotals and enable drilldown.
The Choose Table Layout step in the Report Wizard will display the dialog as shown below:
The default of Stepped displays the groupings as shown above. Block moves things in a little closer which saves space, but it disables drilldown. Include Subtotals will provide fields totals based on groupings as per user wish. Enable drilldown will initially hide details and allow expanding with a click on the plus icon. Fill in the dialog as shown below:
Click the Next button to move on to the Chose the Table Style dialog which we will discuss in the next section.
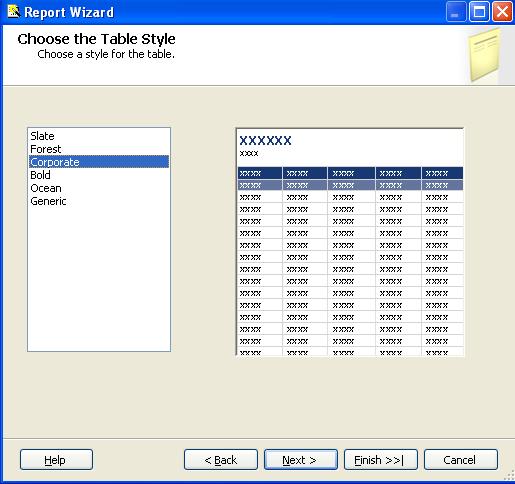
Choose the Table Style
The Choose Table Style step of the Report Wizard allows us to choose from a number of different styles.
The Choose Table Style step in the Report Wizard will display the dialog as shown below:
Choose a style from the list of available options, then click the Next button to move on to the Completing the Wizard dialog which we will discuss in the next section.
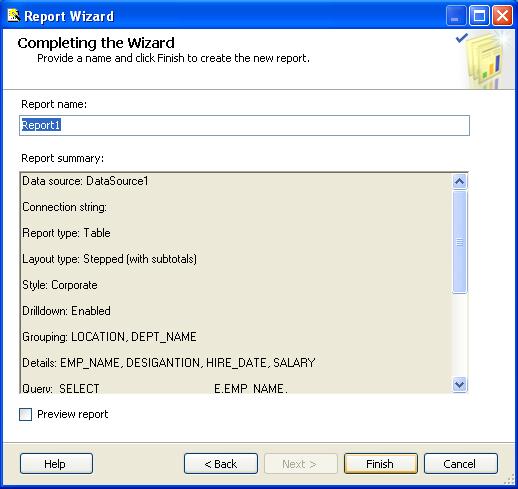
Complete the Wizard
The Completing the Wizard step in the Report Wizard will display the dialog as shown below:
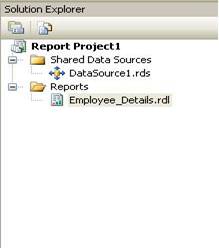
You should provide a descriptive name for your report in the Report Name textbox. You can click the Preview report check box if you would like to see what your report will look like. Click the Finish button to complete wizard. You will now see your report in the Solution Explorer as shown below:
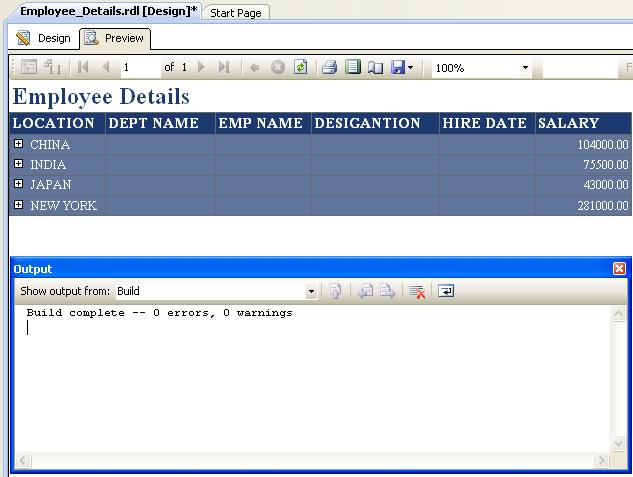
The report will also be displayed in the Report Designer. Click on the Preview tab to render your report. A portion of the report is shown below:
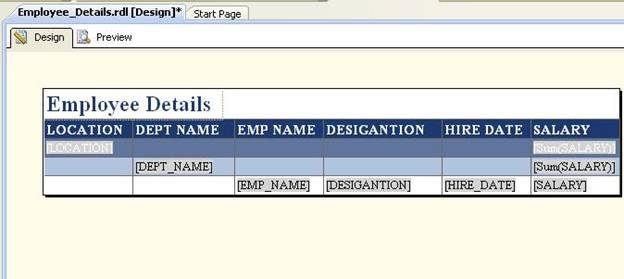
We're going to make a couple of changes to the report. Click on the Design tab; you will see the following:
We're going to put spaces between the words in the heading, make the columns a little wider, and add subtotal and total for DEPT_NAME and LOCATION.
Here are the steps explained below:
- Click in the report heading between and add spaces as desired for all report columns.
- Add subtotal for location-wise and department-wise.
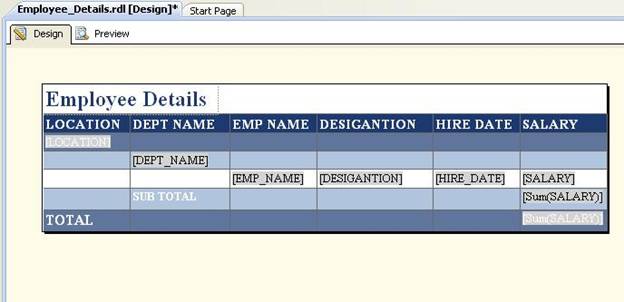
After making these changes, the report design should look like this:
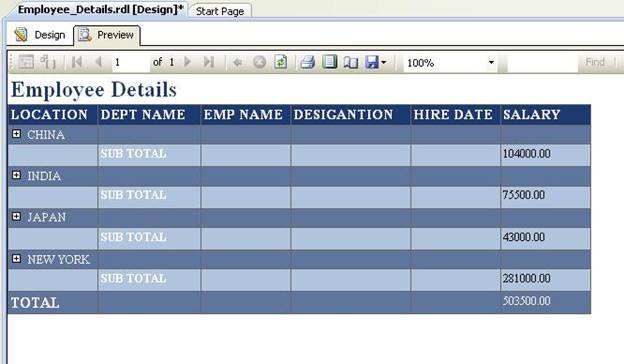
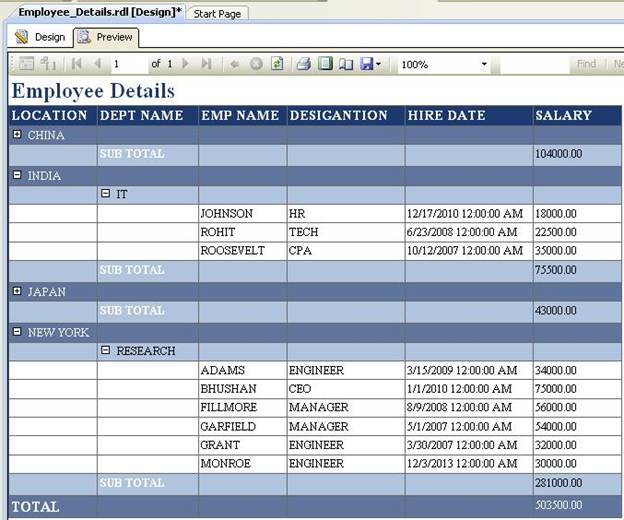
Click on the Preview tab to display the report:
You can click on the + icon to the left of the Location Category Names to drilldown to Location details as shown below:
This completes the tutorial section on the Report Wizard.
Reports Deployment
When we have completed a report, we need to deploy it so that other users can run it. In this section, we will show how to deploy reports using the following methods:
- Business Intelligence Development Studio (BIDS)
- Report Manager
In SQL Server 2005 Reporting Services, you could also use SQL Server Management Studio to deploy reports. This functionality has been removed in SQL Server 2008.
You can also deploy reports to a SharePoint when you configure Reporting Services in SharePoint Integration mode. We are not covering SharePoint Integration in this tutorial.
Now let's continue on to the next section to see how to deploy reports from BIDS.
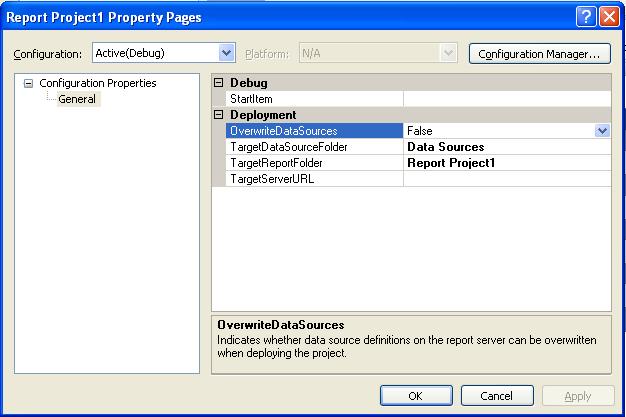
Business Intelligence Development Studio (BIDS) provides the capability to deploy reports. In order to deploy our reports and data sources using BIDS, we need to specify some project settings. Right click on the project name in the Solution Explorer, then select Properties from the popup menu; you will see the dialog as shown below:
The following is a description of the deployment settings:
OverwriteDataSources - Specify True or False; when you deploy using BIDS you probably want to choose False so that if the Data Source already exists on the deployment target, it does not get overwritten. The reason is that the connection strings in your development server are probably different than your target deployment server.TargetDataSourceFolder - The name of the folder where you want to deploy you Data Sources; the default value is Data Sources.TargetReportFolder - The name of the folder where you want to deploy your reports. The default value is the name of your project.TargetServerURL - The URL of your deployment report server; use the formathttp://SERVERNAME/reportserver where SERVERNAME is the name of the server where you installed Reporting Services.
Now, you can deploy all data sources and reports in the project by right clicking the project in the Solution Explorer and selecting Deploy from the popup menu. You can deploy specific data sources and/or reports by selecting them in the Solution Explorer (use Ctrl + Click to select multiple), right clicking on a selected item and choosing Deploy from the popup menu.
The success or failure of your deployment will be reported in the Output window as shown below:
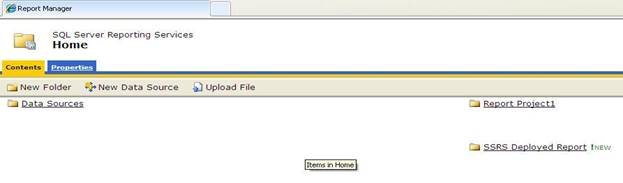
After successful deployment of our sample project, you will see the following on the Report Manager home page:
Report Manager
Report Manager is the web-based application included with Reporting Services that handles all aspects of managing reports. In this section, we will walk through report deployment using the Report Manager.
To begin, navigate to the Report Manager home by opening your browser and typing in the URL; e.g.http://SERVERNAME/reports, where SERVERNAME is the server where the Report manager is deployed.
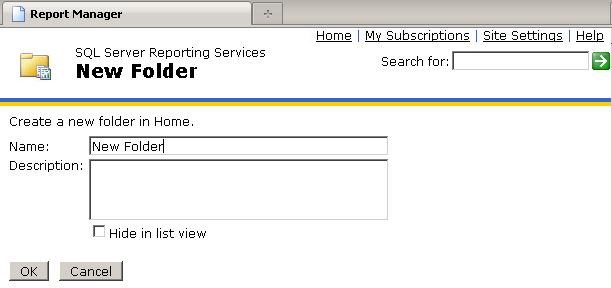
To deploy using the Report Manager, we would create folders for our data sources and reports as shown above by clicking the New Folder button. Navigate to the new folder by clicking on it, and then click the Upload File button to upload either a data source or a report.
When you click the New Folder button, the following dialog will be displayed:
Fill in the Name textbox; e.g. SSRS Deployed Report and click OK. The Report Manager now displays the new folder as shown below:
Click on the SSRS Deployed Report to navigate to the folder. We are going to create a new data source and upload a report.
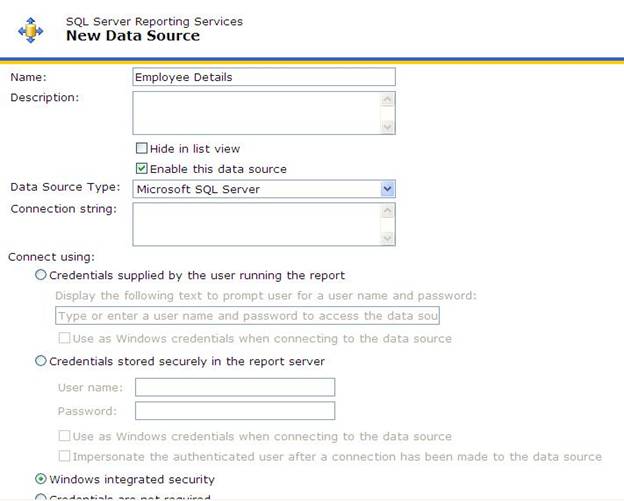
When you deploy your data sources, the settings will be different than what you have in your development environment. Click the New Data Source button to create and configure your data source as shown below:
The following are the main points about creating a data source:
- You have to enter the connection string;
- The Connect using option selected is Windows integrated security
- The Credential stored securely in the report server option along with checking Use as Windows credentials.
After clicking OK to finish creating your data source, click the Upload File button to deploy a report. Fill in the dialog by navigating to the report that you want to deploy and picked the file Employee_Details.rdl file.
After clicking OK to deploy the report, you can click on the report in the Report Manager to display report output and hence, you have uploaded report file successfully.
That’s it!!! This finishes your first report using SQL Server Reporting Services.