Crystal Report
- Simple Crystal Report
- Group in Crystal Report
- Graph in Crystal Report
- Cross-Tab in Crystal Report
- Sub report in Crystal Report
Using the Code
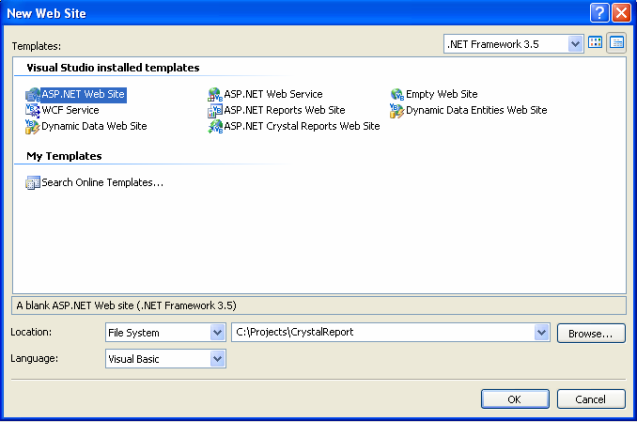
Let’s start by creating a new ASP.NET Web Site. Figure 1 shows the initial web site creation screen.
Figure 1
By clicking OK button, you can see the project created in solution explorer. Now let’s start with Crystal Report.
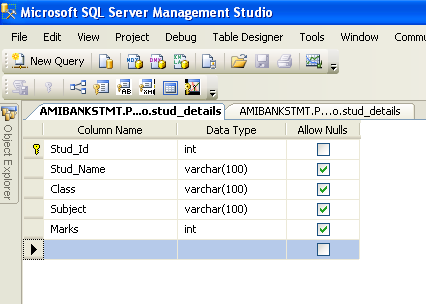
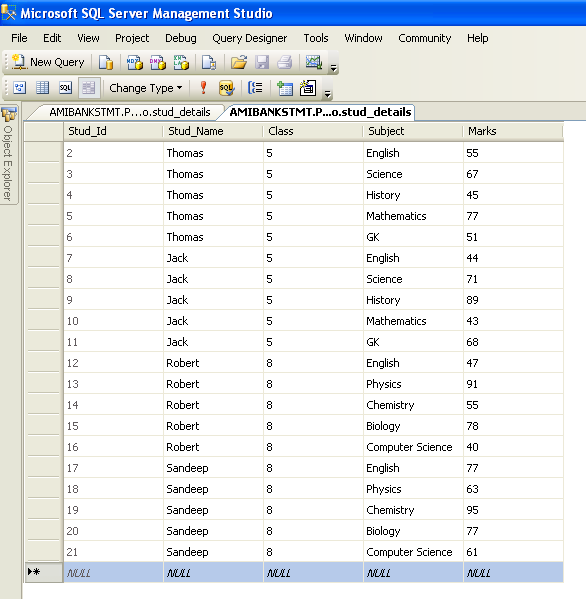
Before that, I am going to show my table structure and data in table. So this will help you to understand the steps easily. Figure 2 will show the table structure and Figure 3 will show the data in table.
Figure 2
Figure 3
But in the attached project, I am getting data from the XML file. I have saved all the data from table to XML. So you can easily use the attached project. Next Dataset (xsd file) creation.
There are so many ways to pass the data to Crystal Report. Here I am using Dataset (xsd file) to bind Crystal Report. In my point of view, this is the best way to bind. So, next step is Dataset (xsd file) creation.
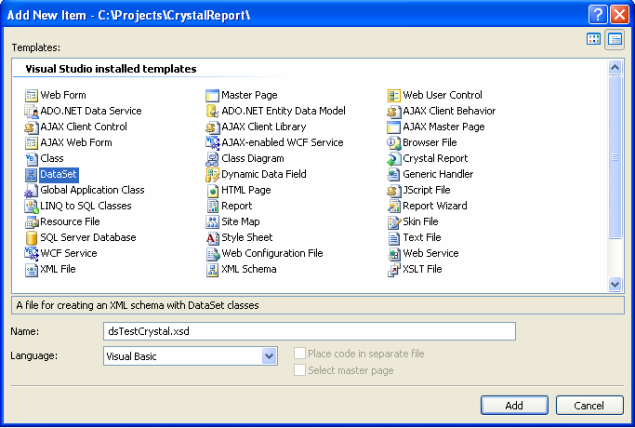
Go to Solution Explorer -> Right click on the Project -> Add New Item. Figure 4 shows the Dataset creation.
Figure 4
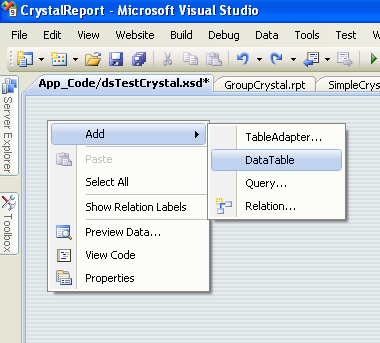
Once you click on Add button, it will ask one confirmation message. Just click yes. Now you can see thedsTestCrystal.xsd dataset file opened in Visual Studio. Here you need to create one Data Table with all the columns names you need to shown in Crystal Report. To Create Data Table, see the below Figure 5.
Figure 5
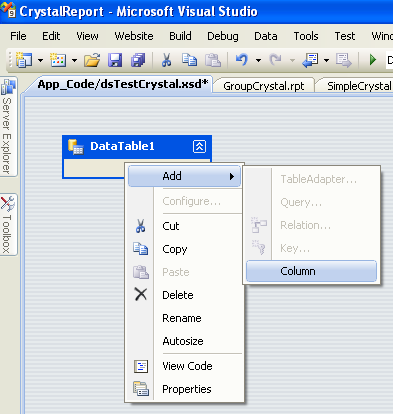
Now you can see Data Table created in the Dataset. Next, we need to add the columns names need to shown inCrystal Report. Please note that this Data Table column names and data types should be the same as your table in database. If you are getting any data type property mismatching error, just think that this is the problem. To Create Column names, see the below Figure 6.
Figure 6
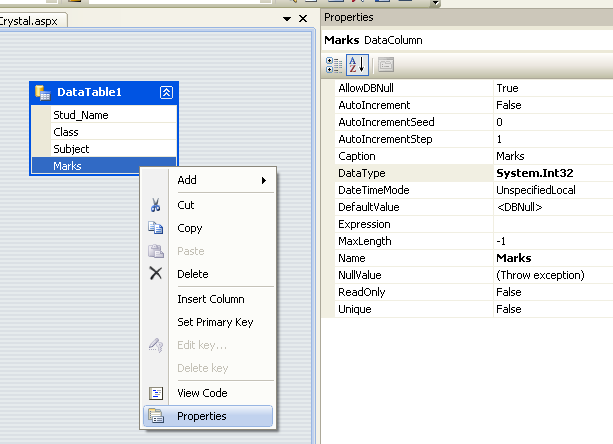
Add all the columns one by one and set the correct data type. Here by default, data type is string. If any columns have different data type, we need to change manually. In this project, I am using ‘Marks’ column data type as int. So to change the data type, see the below Figure 7.
Figure 7
Dataset (dsTestCrystal.xsd) creation has been done. Now we need to design Crystal Report.
1. Simple Crystal Report
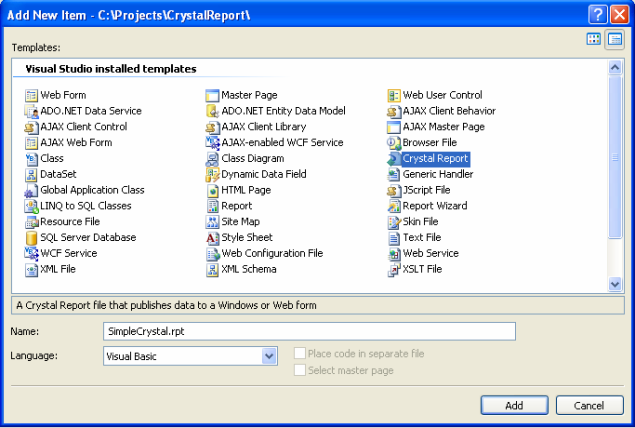
Go to Solution Explorer -> Right click on the Project -> Add New Item. Figure 8 shows the Dataset creation.
Figure 8
On click of Add button, you will get Crystal Report Gallery window. In that, select Using the Report Wizardcheck box and Click OK button. Now you will get the below Figure 9.
Figure 9
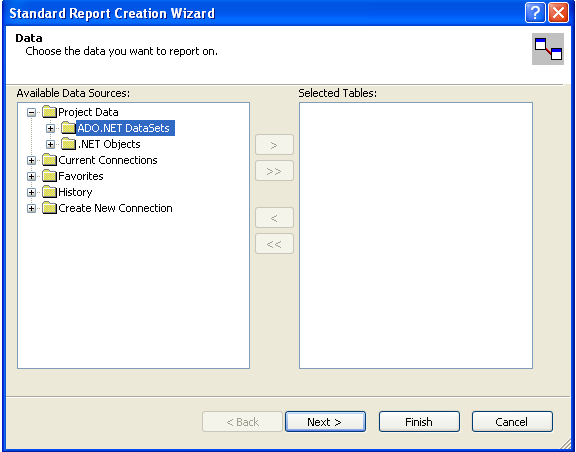
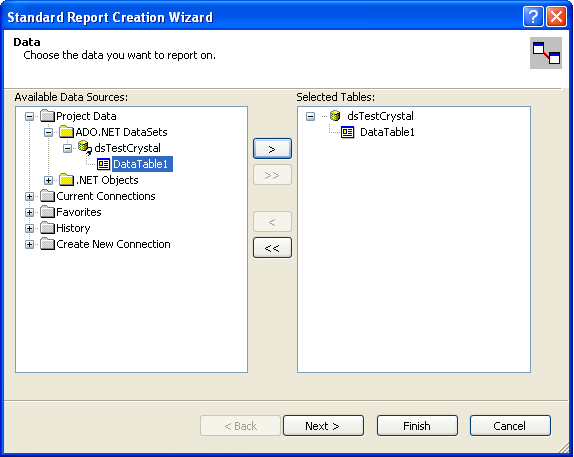
Now expand the ADO.NET Datasets folder. There you can see the Dataset (dsTestCrystal) we created. Under dsTestCrystal, you can see the Data Table we created. So select this Data Table and click the arrow button to move to the Selected Tables list box as shown in the below Figure 10.
Figure 10
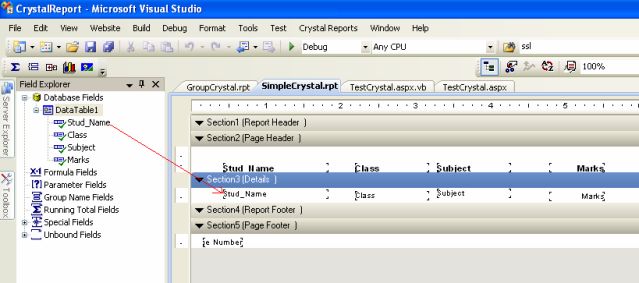
Just click the Finish button. Now you can see the Crystal Report opened in Visual Studio. In your left side, you can see Field Explorer. In case you cannot see it there, just go to menu Crystal Reports -> Field Explorer. Field Explorer View is shown in below Figure 11.
Figure 11
Now you can drag and drop the columns from Field Explorer to Details Section in Crystal Report. You can see the final view of the Crystal Report in the next Figure 12.
Figure 12
Crystal Report design also done. Now we need to pass the data to the Dataset (dsTestCrystal) and we need to set this Dataset to Crystal Report.
Now just create one aspx page. Add the below code in .aspx page.
 Collapse | Copy Code
<CR:CrystalReportViewer ID="CrystalReportViewer1" runat="server"
DisplayGroupTree="False"  />
Then write the below code in .aspx.vb page to generate Crystal report.
Collapse | Copy Code
Dim rptDoc As New ReportDocument
Dim ds As New dsTestCrystal
Dim sqlCon As SqlConnection
Dim dt As New DataTable
dt.TableName = "Crystal Report Example"
sqlCon = New SqlConnection("server='servername';
Initial Catalog='databasename';user id='userid';password='password'")
Dim da As New SqlDataAdapter("select Stud_Name, Class,
Subject, Marks from stud_details", sqlCon)
da.Fill(dt)
ds.Tables(0).Merge(dt)
rptDoc.Load(Server.MapPath("SimpleCrystal.rpt"))
rptDoc.SetDataSource(ds)
CrystalReportViewer1.ReportSource = rptDoc
Now run your page and the data generated in Crystal Report.
2. Crystal Report using Grouping
Here I am going to explain only the Crystal Report design. Remaining things you can refer from the previous one.
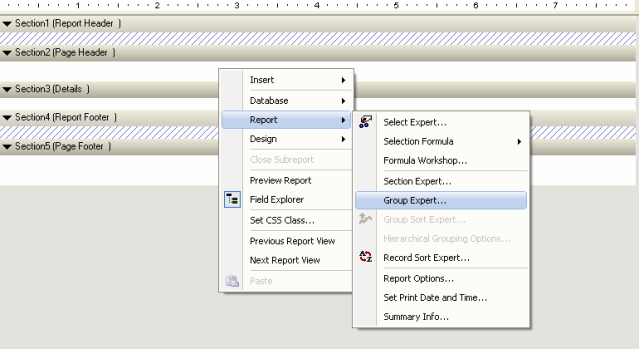
I am going to use the Group like Class -> Name -> Subect & Marks. Here Class and Name is Group. Subject and Marks will come in detail section. To create Group, see the below Figure 13 & 14.
Figure 13
Figure 14
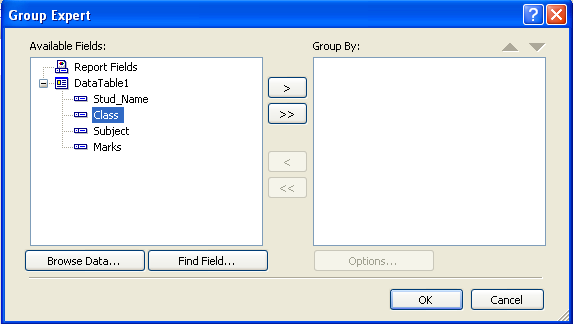
Class is the main group. So first we need to move Class field to Group By list box by clicking the arrow button. Then we need to move the Stud_Name field. See the below Figure 15.
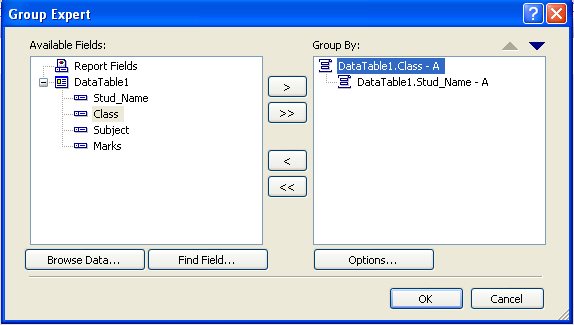
Figure 15
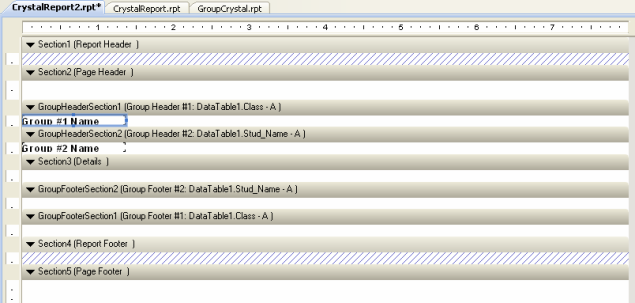
Now click OK button and see the difference in Crystal Report. There you can see two Header & Footer added and two fields Group #1 Name, Group #2 Name. Group #1 Name is Class and Group #2 Name is Stud_name. See the below Figure 16.
Figure 16
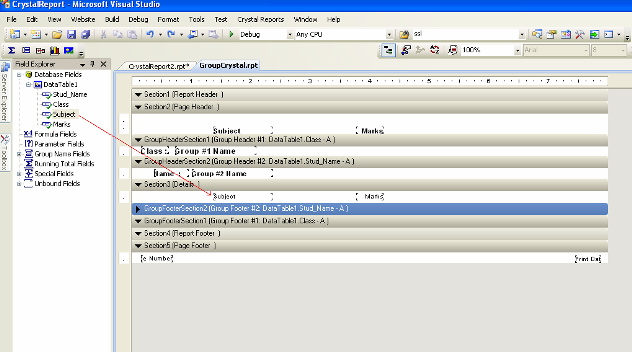
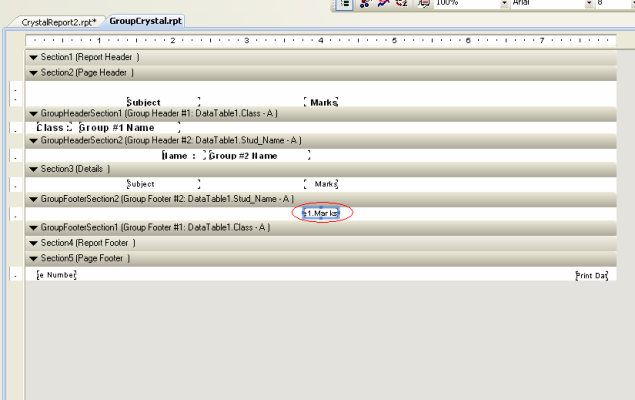
Now you can drag and drop the columns from Field Explorer to Details Section in Crystal Report. You can see the final view of the Crystal Report in the next Figure 17.
Figure 17
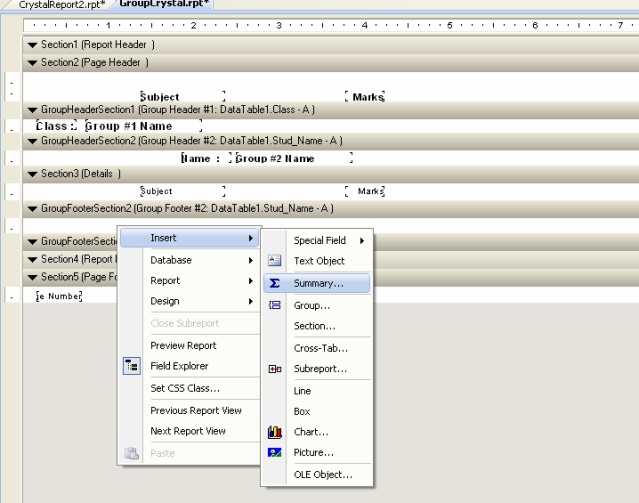
Now I am going to add sum of marks for the student. In Stud_Name GroupFooterSection, we need to add this sum. See the below Figure 18.
Figure 18
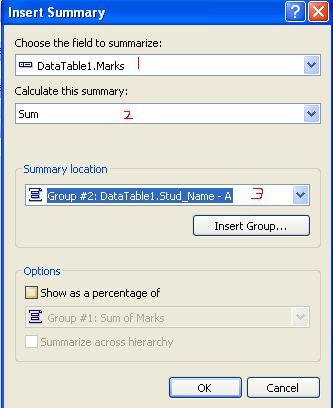
On click of Summary you will get the below Figure 19.
Figure 19
We need the sum of Marks column. So select Marks field from first combo box. Then select Sum from the second combo box. Finally, we need sum of marks for each student. So we need to select Stud_Name group from third combo box. Then click OK button. Now you can see the sum field added in Stus_Name footer section. See the Final view of Crystal Report in the below Figure 20.
Figure 20
3. Chart in Crystal Report
Here also, I am going to explain only the Chart design. Remaining steps are the same as the first one.
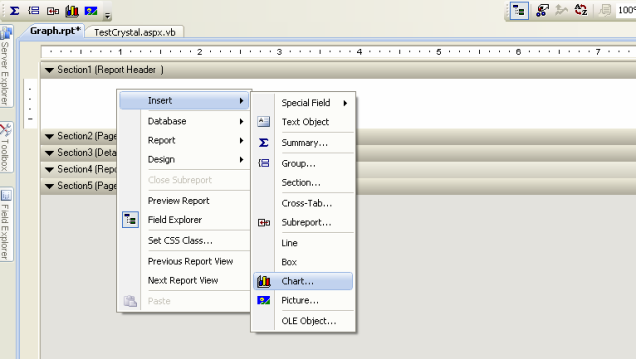
I am going to show the students total marks student wise. X-axis is Student names and Y-axis is Total Marks. Lets start the creation of chart. See the below Figure 21.
Figure 21
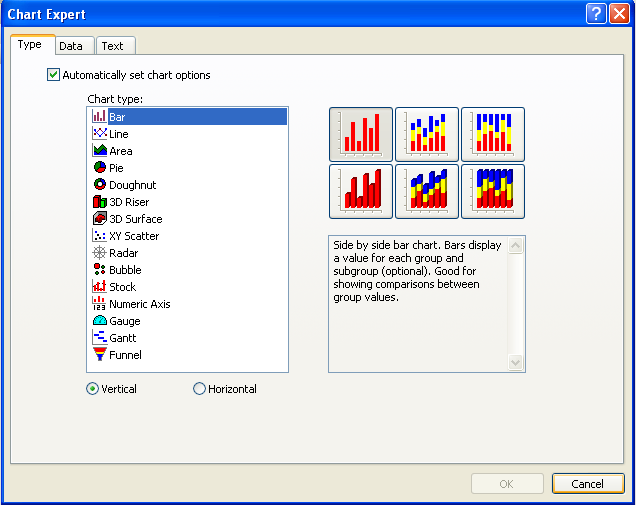
Once you click the Chart, you will get the below Figure 22. Here you can see number of chart formats. So you can select any one from here. I am selecting Bar from the options.
Figure 22
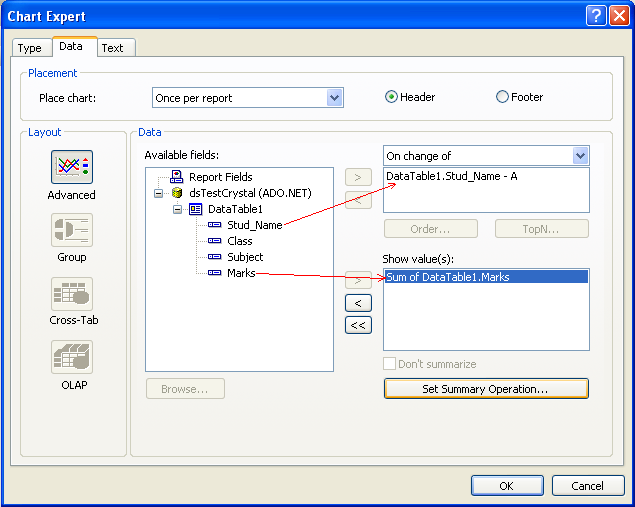
Now move to the second tab which is Data. See the below Figure 23.
Figure 23
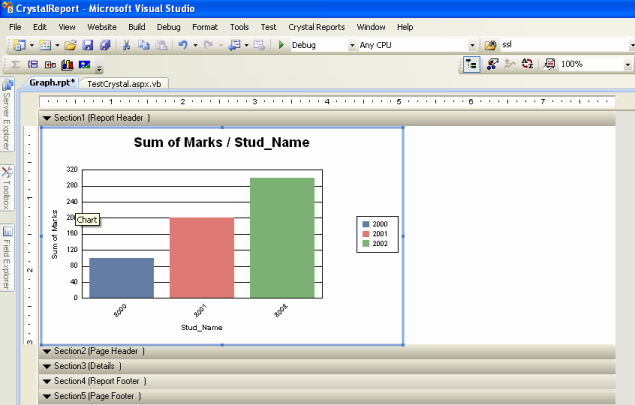
As I said earlier, Stud_Name we are using in X-axis. So we need to move Stud_Name to first (on change of) list box. Then move Marks to the second list box (Show value(s)). By default, Sum will display there. If you want to change Sum to some other, you can change by clicking the Set Summary Operation button. Then click Ok button. You can see the chart created in Report Header section. See the Final view of Crystal Report in the below Figure 24.
Figure 24
Now Run the web site and see the chart. That’s all. It’s done.
4. Cross-Tab in Crystal Report
Here also, I am going to explain only the report design. Remaining steps are the same as the first one.
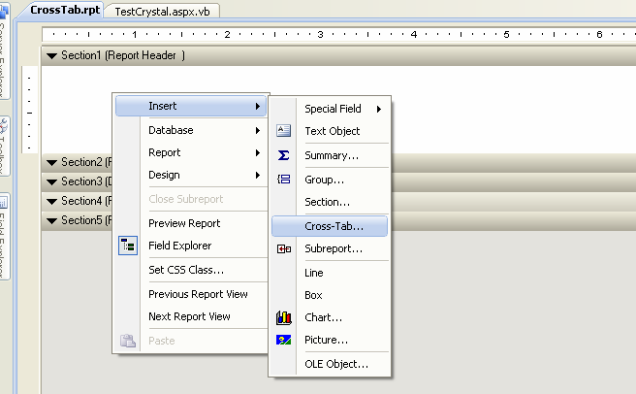
First, you need to know the reason why we need to use Cross-Tab. If you want to display the subject column wise, we need to use cross-Tab. Because subject can vary for different class, we cannot design report with fixed columns. So in this scenario, we can go for Cross-Tab. See the Cross-Tab report creation in below Figure 25.
Note: We can place Cross-Tab only in Report Header/Footer.
Figure 25
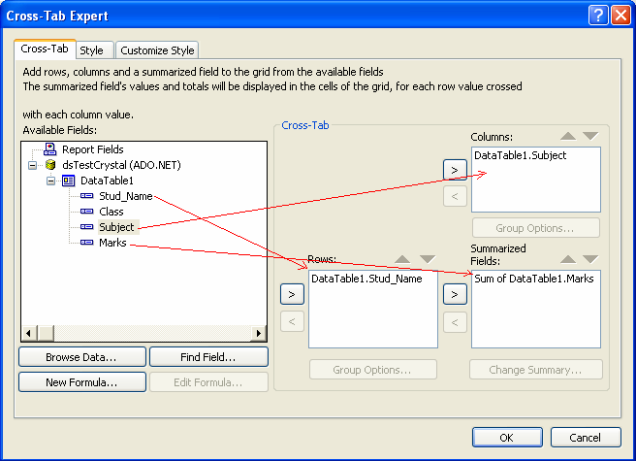
Once you click the Cross-tab, you can see the rectangle mouse pointer. So you need to place that only in Report Header/Footer. Once you place that, you will get the below Figure 26.
Figure 26
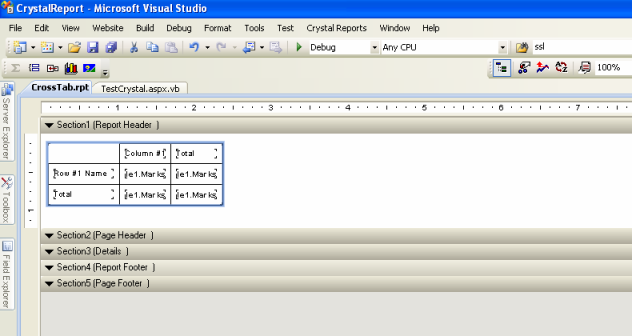
As I said in the earlier, we are going to put subject in column wise. So move Subject field to Columns listbox. Then before showing the marks of each subject, we need to show the Student name. So Move Stud_Name to Rows listbox. Finally move Marks to Summarized Fields listbox. Then click Ok button. You can see the report created in Report Header/Footer section. See the Final view of Cross-Tab Report in the below Figure 27.
Figure 27
Now Run the web site and see the report. That’s all. It’s done.
5. Sub Report in Crystal Report
Here also, I am going to explain only the report design. Remaining steps are the same as the first one.
Here, I am going to show the each students' marks in graph by using sub report. So, to use sub report, first I am going to create student group header. See the below Figure 28.
Figure 28
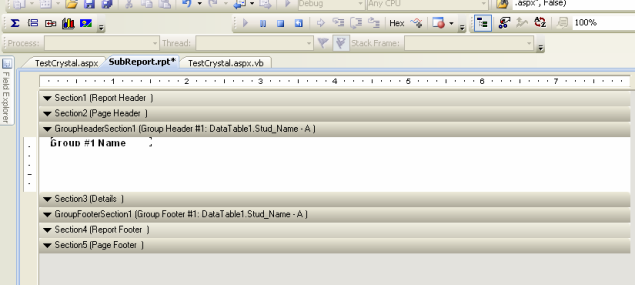
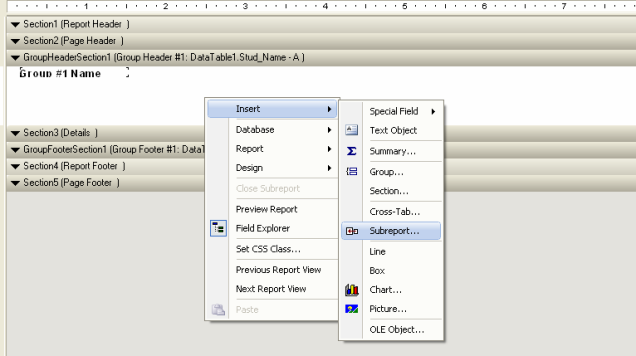
Then in group header section, we need to create sub report. To do this, follow the below Figure 29.
Figure 29
Then place the mouse in the group header section. Once you place the mouse cursor, you will get one popup window. See the below Figure 30.
Figure 30
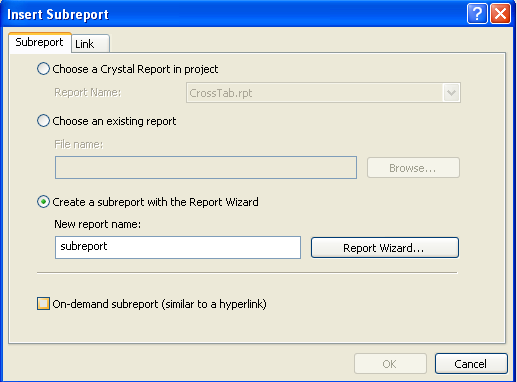
Here check the third check box to create new sub report. Then type the sub report name. Then click the Report Wizard button to select data set. Select the dataset like the below Figure 31.
Figure 31
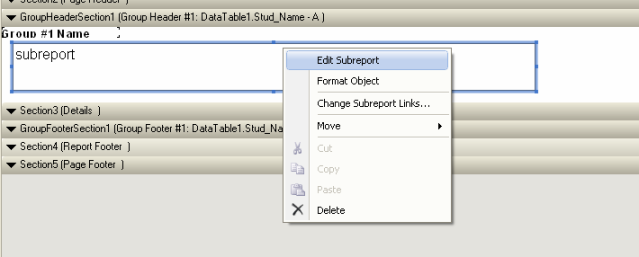
Then click the Finish button and click OK button in sub report window. Now follow the below Figure 32 to edit the sub report.
Figure 32
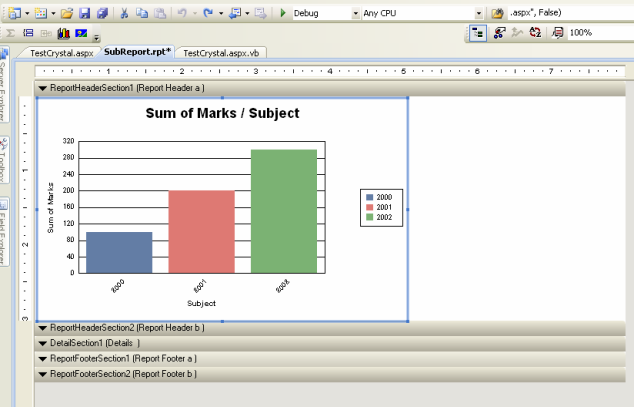
Now you will get the below Figure 33. Here you can create Graph by using 3rd section (Graph Creation). Here use Subject as X-axis and Marks as Y-axis. See the below Figure 33.
Figure 33
Now Run the web site and see the report. That’s all. It’s done.